This webpage is best viewed on desktop with a full screen browser.


The people of California receive abundant gifts from the ocean: food, medicine, energy, wellbeing, and more. The ocean is an essential part of California’s economy, culture, and history.

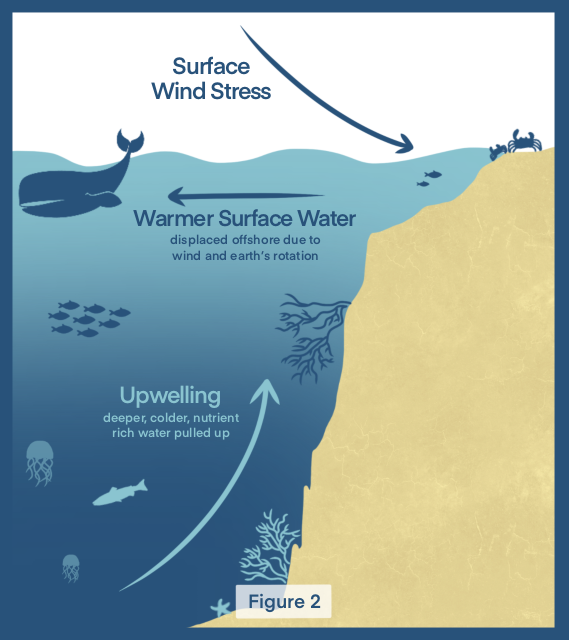
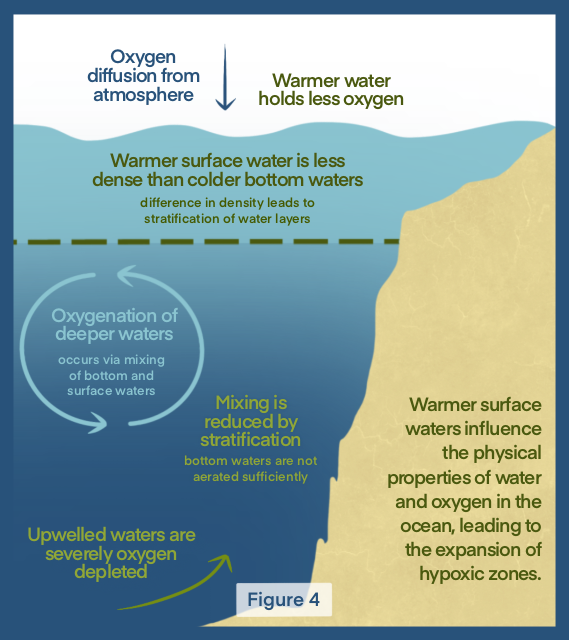
However, the past few decades of climate change have led to the increase of ocean heat waves, ocean acidification, and, a lesser known phenomenon, ocean deoxygenation. Protecting and sustaining our relationship with the ocean through these changes requires a better understanding of how marine life is affected and how human actions must change in response.

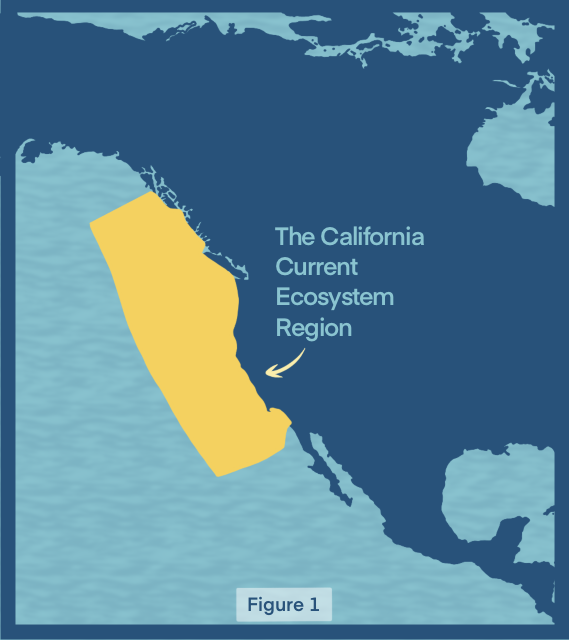
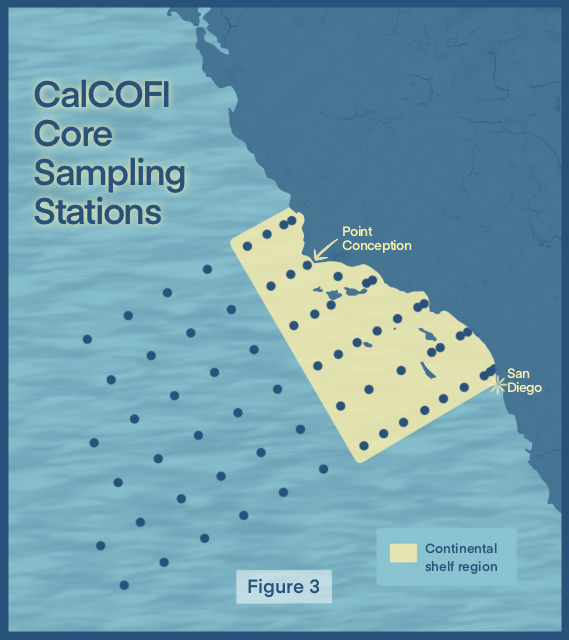
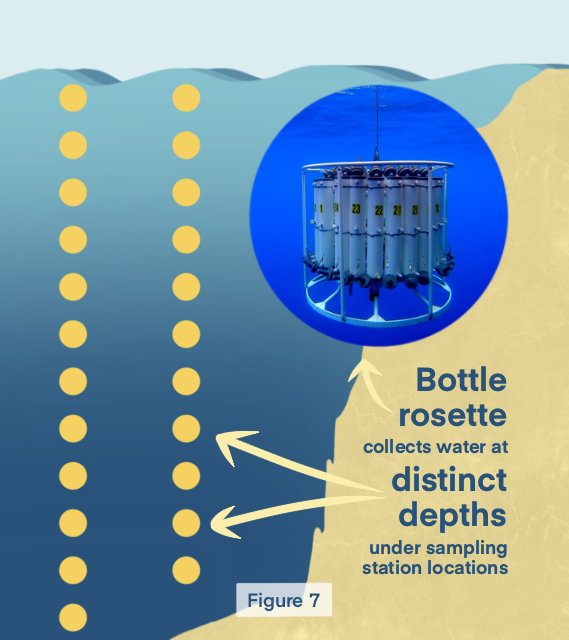
Hence, the California Cooperative Oceanic Fisheries Investigations (CalCOFI) comprehensively observes and monitors the ocean off the coast of California, and has been doing so for over 70 years. These observations are vital to understand the health of the ocean off of California and thus inform the sustainable management of our precious marine resources.

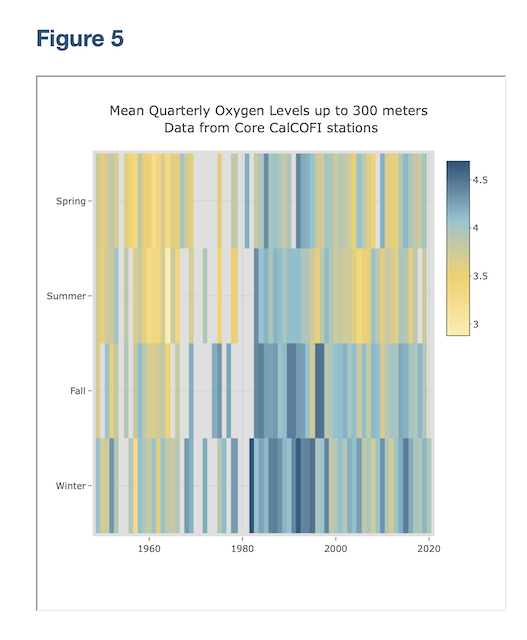
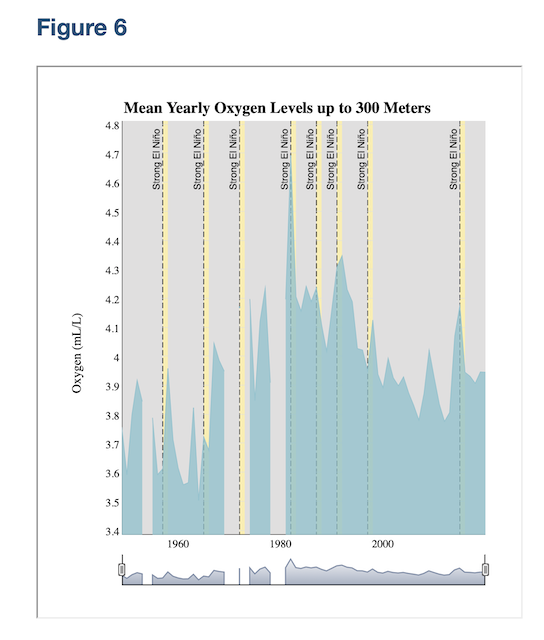
Numerous studies of CalCOFI’s oxygen data have demonstrated that oxygen levels have been declining off of the California coast, disrupting the balance of the marine ecosystem. De-oxygenation can severely reduce species growth and survival. In co-occurrence with marine heatwaves and ocean acidification, loss of oxygenated habitats can cause many mobile animals like sharks to move to shallower waters near the coast.

Here, we will take you on a journey to explore CalCOFI’s data on oxygen levels, to explore how this critical component of the ecosystem varies naturally in the ocean off of the California coast and discuss how the changing climate’s impact on oxygen places the vitality of life throughout the ocean at risk.


Scroll along to join us on this exploration of oxygen off the coast of California.

CalCOFI

California Cooperative Oceanic Fisheries Investigations


CalCOFI is the oldest integrated ecosystem ocean observing program in the world.

Ocean observing programs are research and monitoring programs that collect long-term measurements on the environment and ecology of the ocean.

These programs collect observations that are vital to generate the shared knowledge we need to address our increasingly complex social and environmental challenges including climate change, overfishing, and food insecurity. Given all the gifts we receive from the oceans, CalCOFI’s work provides us with the wisdom we need to sustain and satisfy our collective needs.

CalCOFI has been collecting observations on the physics, biogeochemistry, and biology of the California Current Ecosystem since 1949. The long historical record of their observations provides us with information that is increasingly more relevant to mitigating and adapting to climate change.


Scroll down to learn more about CalCOFI’s region of interest - the California Current Ecosystem.

The California Current Ecosystem

What is it?


Right off of the coast of California is the region of the ocean known as the California Current Ecosystem (CCE). The CCE is the area of the ocean highlighted in Fig. 1 stretching about 1900 miles vertically from southern British Columbia to Baja California.

California’s commercial and recreational fishing activity was responsible for nearly $25 billion in economic activity and the creation of 142,000 jobs in 2016, according to the National Marine Fisheries Service.

A significant characteristic fueling the productivity in this region is that the CCE is one of the four upwelling driven ecosystems in the world.


Curious to learn about what upwelling is? Scroll down!


Up•well•ing /ɘp, 'weliNG/

Noun: A natural phenomena whereby seasonal winds in spring and summer cause surface waters to flow offshore, making room for cooler, deeper waters to rise near the coast.


Coastal upwelling is the process by which strong winds from the north and northwest blow down the coast of California and, due to the Earth’s rotation, cause the surface waters to flow offshore.

Water from deeper in the ocean replaces the offshore-flowing surface waters.

This is significant because deeper waters are colder and contain more nutrients due to the collection of decomposing organic sediment.

These nutrients fuel life in the ecosystem from the bottom up, supporting the smallest microbes and phytoplankton as well as all sorts of fish and predators, leading to the large populations of marine mammals, seabirds, and fisheries in the region.


This same process that drives much of the productivity off the coast of California also makes the ecosystem uniquely vulnerable to the detrimental impacts of climate change. CalCOFI’s long-term observations of this region are essential to understanding this vulnerability and mitigating the resulting negative impacts on marine life and California communities.


Scroll down to learn about which portions of CalCOFI’s data we will engage with to understand this vulnerability.

How does CalCOFI sample off the coast of California?


CalCOFI conducts quarterly research cruises off the southern and central California coast to collect a vast range of physical, chemical, and biological data; weather, bird, and marine mammal observation, seawater collection and analysis, biological sample collection using various nets, and more.

While some of these measurements are collected continuously over the duration of each cruise, a majority of the data is recorded at distinct sampling station points.

Fig. 3 displays the core region where CalCOFI samples, known as CalCOFI’s core sampling station grid.

This core grid spans the waters in and beyond the Southern California Bight, the curved section of the CA coastline from Point Conception south to San Diego. The Bight creates a large, productive open bay with diverse seafloor habitats and marine life, and is also the most densely populated region of the CA coast.

This page will showcase data collected from the core sampling stations located on the continental shelf. Dissolved oxygen levels are monitored at each of these stations by analyzing seawater samples collected at different depths under each location: from the surface down to over 1000 meters deep.


Curious to learn more about how oxygen is changing off the coast of California? Scroll down to learn more about oxygen’s natural variability, including what it means for marine life and people in California.

How is oxygen changing off the coast of California?


Oxygen is critical to the health of the ocean and is a fundamental requirement for marine life. Nearly all multicellular marine organisms and many microbes depend on the dissolved oxygen (DO) in the ocean the same way we depend on oxygen in the air.

Sources of oxygen in the ocean include the oxygen that diffuses in from the atmosphere at the surface and the oxygen produced by photosynthesis in the upper, sunlight-filled waters. Oxygen from these upper layers is then transported to deeper layers through vertical mixing.

Oxygen is consumed by organisms during respiration, by the decomposition of organic matter, and absorption into oxides and carbon compounds.


When a region of the ocean is deprived of adequate DO such that the physiological and ecological processes of the marine ecosystem are impaired, the state of low oxygen is called hypoxia and the region is called a hypoxic zone.

Hypoxia occurs when the rate of oxygen consumption in a region exceeds the rate at which oxygen is replenished. Climate warming disrupts the balance between these two processes and has been worsening de-oxygenation in the CCE.

Fig. 4 displays how various physical processes affect dissolved oxygen levels in the ocean. Climate change affects these processes, as highlighted by the green text, leading to the expansion of hypoxic zones throughout the deeper waters of the CCE.


Curious to know how upwelling futhers the reduction of oxygen levels? Scroll down to find out!

How does oxygen vary seasonally off the coast of California?


As mentioned earlier, the deeper waters that are upwelled during spring and summer are poor in oxygen. The primary cause of seasonal low-oxygen surface waters is this upwelling.

The upwelled waters are also rich in nutrients. These nutrients increase ecosystem productivity by fueling phytoplankton algal blooms that support large populations of consumers, with the effects rippling throughout the food web.

During these productive seasons, respiratory demand for oxygen is increased, furthering de-oxygenation. Furthermore, climate change is hypothesized to intensify upwelling, which would increase the risk of hypoxia throughout the CCE.

Analysis of CalCOFI’s data reflects lower oxygen levels during the upwelling seasons.

The heatmap in Fig. 5 displays the average dissolved oxygen concentration in the upper 300 meters of seawater, aggregated over all the core on-shelf stations that were sampled at the time, for each quarter since 1949. The yellow stripes correspond to lower levels of DO while the blue stripes indicate higher levels of DO. Gray stripes indicate quarters in which less than 3 core on-shelf stations were sampled. Click here to open the plot in a new tab and hover over with your cursor to see the exact average oxygen concentration and the number of seawater samples that were analyzed for a given quarter.

It is evident that spring and summer have lower oxygen levels on average when compared to winter and fall.

How does oxygen vary across years off the coast of California?


In addition to the seasonal variation in oxygen levels caused by upwelling, the CCE is affected by systems of natural multi-decadal climate variation patterns such as the El Niño Southern Oscillation (ENSO, ~2-7 year long cycle).

ENSO has positive and negative phases that affect sea surface temperatures, atmospheric conditions, upwelling strength, and more. Positive ENSO phases lead to El Niño events with warmer conditions, weaker upwelling, higher oxygen levels, and lower nutrient concentrations. Negative ENSO phases lead to La Niña events with the opposite conditions.

The index used to track how ENSO phases affect sea surface temperatures in the ocean is called the Oceanic Niño Index (ONI). Positive ONI values indicate El Niño and negative ONI values indicate La Niña.

Fig. 6 displays a time series graph of the average dissolved oxygen concentration in the upper 300 meters of seawater, aggregated over all the core on-shelf stations sampled in a given year, since 1949. The yellow lines highlight years with strong El Niño events, where the ONI exceeded 1.5. Click here to open the plot in a new tab for closer examination of the exact oxygen values.

It is evident that, overall, the annual average oxygen level on the continental shelf of the Southern California Bight varies a lot from year to year. We can also see that the strong El Niño events correspond with local maximums in oxygen levels in the graph, reflecting how climate events impact dissolved oxygen concentration.


Anthropogenic (human-caused) climate change is an additional agent affecting oxygen levels, layered on top of all the natural drivers of oxygen’s variability we have highlighted here.

Thus, teasing apart anthropogenic declines in oxygen from natural variation patterns requires sampling consistency and longer ranges of time series data on oxygen in the coming decades.

Climate projection models predict that the impact of anthropogenic warming will increasingly dominate natural variation patterns throughout the twenty-first century. Because of this, CalCOFI’s continued monitoring of the ocean will be essential to understanding and predicting impacts on marine life and fisheries.


We hope that this page has helped you learn more about the ocean off the coast of California; how oxygen levels vary naturally due to upwelling, marine ecosystem respiratory demands, climate oscillation events; how climate change affects this variability and exacerbates the risk of hypoxia; and how crucial CalCOFI’s monitoring work is in the face of these changing ocean conditions. Thanks for scrolling along with us! :)


It is important to note, given how dynamic oxygen levels are in the ocean, that aggregation of oxygen data over time, location, and depth, while useful for conveying high level trends, inevitably loses a lot of the nuance in oxygen’s variability. Since the graphs in Fig. 5 and Fig. 6 display aggregated summaries of oxygen concentration, we encourage folks who are interested in exploring more of oxygen’s spatial and temporal variability to take a look at CalCOFI’s other data products. Scroll down to the next page to learn more about the data utilized in this project!

About the Data

The oxygen data employed in this project is from CalCOFI’s bottle database, publicly available alongside multiple other datasets here.

The bottle database contains oceanographic data - including temperature, salinity, dissolved oxygen, chlorophyll-a, nutrients, and more - measured from seawater samples that are collected at CalCOFI stations. Seawater samples are collected by lowering a rosette of bottles, shown in Fig. 7 into the water. The bottles collect seawater at many distinct depths: from the surface, down to over 5000 meters deep.

The graphs above utilized data from the upper 300 meters of samples, collected from the core transect lines (76.7 to 93.3), at on shelf stations (stations numbers ≤ 60).

The code for this project can be found here.

Graphics drawn by Mallika Gupta. Adapted from references below.

References

Breitburg, Denise, et al. “The Ocean Is Losing Its Breath: Declining Oxygen in the World’s Ocean and Coastal Waters; Summary for Policy Makers.” 2018, https://unesdoc.unesco.org/ark:/48223/pf0000265196.

“California Current Region.” California Current Region | National Marine Ecosystem Status, https://ecowatch.noaa.gov/regions/california-current.

Gallo, Natalya D., et al. “Bridging from Monitoring to Solutions-Based Thinking: Lessons from Calcofi for Understanding and Adapting to Marine Climate Change Impacts.” Frontiers in Marine Science, vol. 6, 2019, https://doi.org/10.3389/fmars.2019.00695.

Limburg, Karin E., et al. “Ocean Deoxygenation: A Primer.” One Earth, vol. 2, no. 1, 2020, pp. 24-29., https://doi.org/10.1016/j.oneear.2020.01.001.

“Midwestern Regional Climate Center.” MRCC, https://mrcc.purdue.edu/mw_climate/elNino/climatology.jsp#:~:text=the%20definition%20of%20a%20strong,%2D83%20and%201997%2D98.

Nam, SungHyun, et al. “Amplification of Hypoxic and Acidic Events by La Niña Conditions on the Continental Shelf off California.” AGU Publications - Wiley Online Library , https://agupubs.onlinelibrary.wiley.com/.

Quan, Jenna. “What Is Coastal Upwelling and Why Is It Important?” Coastal and Marine Sciences Institute, 23 Mar. 2021, https://marinescience.ucdavis.edu/blog/upwelling.

Ren, Alice S., et al. “A Sixteen-Year Decline in Dissolved Oxygen in the Central California Current.” Nature News, Nature Publishing Group, 8 May 2018, https://www.nature.com/articles/s41598-018-25341-8.

University of California Television. “Research for Resilience on a Changing Planet - The California Cooperative Oceanic Fisheries Investigations.” UCTV, University of California Television, https://www.uctv.tv/shows/Research-for-Resilience-on-a-Changing-Planet-The-California-Cooperative-Oceanic-Fisheries-Investigations-37033.


This page was created by data storytelling interns with CalCOFI and California Sea Grant, Annie and Mallika.

Annie Adams

Annie recently graduated from UCSB, majoring in Statistics and Data Science with a minor in Feminist Studies. She is interested in analyzing data pertaining to the changing climate and environment. Her particular areas of interest are ecosystem services and the socioeconomic impacts of climate change. Annie loves spending time outdoors hiking, biking, camping, and running.

Mallika Gupta

Mallika graduated from UC Santa Barbara in June ’22 with a B.S. in Financial Math and Statistics and a minor in Feminist Studies. Mallika is deeply interested in data visualization, science communication, and user interface design. She has worked with CalCOFI in the past to create a data visualization tool and hopes to continue applying her skills and experience to more work within environmental data science. In her free time, Mallika enjoys doing yoga, reading, singing, and playing guitar.


Acknowledgements

This project would not have been possible without the support of our mentors:

Erin Satterthwaite • Marine ecologist & CalCOFI Program coordinator with California Sea Grant

Trevor Ruiz • Visiting professor at the UCSB Department of Statistics and Applied Probability

Thank you to Alice Ren for reviewing our work and offering feedback!