---
title: "Ingest CCE-LTER ZooScan PRPOOS"
calcofi:
target_name: ingest_cce_lter_zooscan
workflow_type: ingest
dependency:
- ingest_swfsc_ichthyo
output: data/parquet/cce-lter_zooscan/manifest.json
provider: cce-lter
dataset: zooscan
workflow_url: https://calcofi.io/workflows/ingest_cce-lter_zooscan.html
questions_file: metadata/cce-lter/zooscan/questions.csv
dataset_meta:
dataset_name: ZooScan PRPOOS Zooplankton
# display trio, read by the release `dataset` table and the
# consumer apps (calcofi4db >= 3.15.0) — see NEWS for why these
# left the apps' own hardcoded maps
dataset_name_short: ZooScan (Imaged Zooplankton)
category: Zooplankton
color: "#885e08"
# publishes the consolidated core: the sample/measurement/taxon source shape is
# wrangled in the notebook and projected into sample / obs + the taxa refs.
tables_owned:
- {table: sample, shared: true, note: "core event dimension (tow grain)"}
- {table: obs, shared: true, note: "core occurrence headline (bio, zooplankton abundance)"}
- {table: taxon, shared: true, note: "shared taxa reference"}
- {table: dataset_taxon, shared: true, note: "zooscan taxon_id -> taxon_key crosswalk"}
- {table: measurement_type, shared: true, note: "shared registry across datasets"}
erd:
color: "#c2e8f0"
editor_options:
chunk_output_type: console
---
## Overview
**Source**: [ZooScan](https://oceaninformatics.ucsd.edu/zooscandb/) — the SIO
Ocean Informatics ZooScan database (Mark Ohman Lab; interface by Marina Frants).
The portal's bulk download is disabled, so `libs/download_zooscan.R` scripts its
public login + PRPOOS plot CGI (`/cgi-bin/tssubplot_new.py`), whose returned
Plotly page embeds the underlying per-station values as a `data:text/csv` URI.
Each bioclass is fetched in both plot modes and consolidated to
`zooscan_prpoos.csv` (see the Acquire step + `by_taxon/_PROVENANCE.md`).
- **Provider**: `cce-lter` (Ohman Lab / CCE-LTER; sibling of `cce-lter_zoodb` and
`cce-lter_euphausiids`).
- **Grain**: one row per **(sample × taxon × measurement_type)**;
`measurement_value = 0` means imaged-but-absent.
- **Samples**: ZooScan-imaged PRPOOS net tows — one per station occupation on
CalCOFI lines 80/87/90, 2005-present.
- **Taxa** (23): ZooScan machine-classified bioclasses (19 WoRMS-resolved; 4
non-taxonomic operational classes — eggs, multiples, nauplii, others).
- **Measurements**: `zooscan_abundance` (No./m²), `zooscan_biomass_carbon`
(mg C/m²), `zooscan_feret_diameter` (mm), `zooscan_carbon_individual` (µg C).
```{mermaid}
graph LR
  A[zooscan_prpoos.csv<br/>taxon x sample rows] --> B[zooscan_sample<br/>station tows + keys]
  A --> C[zooscan_measurement<br/>long: abundance, biomass, feret, indiv-C]
  A --> D[zooscan_taxon<br/>23 bioclasses + WoRMS]
  C -.sample_id.-> B
  C -.taxon_id.-> D
  B -.ship/cruise/grid.-> E[(shared refs)]
```
## Setup
```{r}
#| label: setup
#| message: false
devtools::load_all(here::here("../calcofi4db"))
devtools::load_all(here::here("../calcofi4r"))

librarian::shelf(
  CalCOFI/calcofi4db, CalCOFI/calcofi4r,
  DBI, dplyr, DT, fs, glue, here, janitor, jsonlite, knitr, lubridate, purrr,
  readr, sf, stringr, tibble, tidyr, units, quiet = T)
options(readr.show_col_types = F)
options(DT.options = list(scrollX = TRUE))

source(here("libs/ingest.R"))   # overwrite, overwrite_all, dir_data

cc           <- read_calcofi_meta(here("ingest_cce-lter_zooscan.qmd"))
provider     <- cc$provider
dataset      <- cc$dataset
tables_owned <- cc$tables_owned
dir_label    <- glue("{provider}_{dataset}")

dir_parquet  <- here(glue("data/parquet/{dir_label}"))
dir_stage  <- cc_stage_path("parquet", dir_label, create = TRUE)
db_path      <- here(glue("data/wrangling/{dir_label}.duckdb"))

if (overwrite) {
  if (file_exists(db_path))                 file_delete(db_path)
  if (file_exists(paste0(db_path, ".wal"))) file_delete(paste0(db_path, ".wal"))
  if (dir_exists(paste0(db_path, ".tmp")))  dir_delete(paste0(db_path, ".tmp"))
}
dir_create(dirname(db_path))
con <- get_duckdb_con(db_path)
load_duckdb_extension(con, "spatial")

meas_type_csv <- here("metadata/measurement_type.csv")
d_meas_type   <- read_measurement_type(meas_type_csv)
```
## Acquire Source Data
`libs/download_zooscan.R` scripts the ZooScan portal (public login + PRPOOS plot
CGI) for the 23 bioclasses × 2 plot modes and consolidates the embedded
per-station CSVs into `zooscan_prpoos.csv`. It runs once then caches; set
`overwrite_all = TRUE` in `libs/ingest.R` to re-scrape.
```{r}
#| label: acquire
source(here("libs/download_zooscan.R"))
zs_dir <- path_expand(glue("{dir_data}/cce-lter/ZooScan"))
zs_csv <- download_zooscan(zs_dir, overwrite = overwrite_all)
```
## Read + Clean
The cruise code is `YYYYMM` + a 2-letter ship code (e.g. `200507NH` = Jul 2005,
R/V New Horizon). We parse `year`/`month`/`ship_key` from it, build `site_key`
from line + station, and a `sample_key` per station tow.
```{r}
#| label: clean
zs_dir <- path_expand(glue("{dir_data}/cce-lter/ZooScan"))

# archive source (consolidated + per-taxon extracts) to GCS for provenance
sync_to_gcs(
  local_dir  = zs_dir,
  gcs_prefix = glue("archive/{provider}/{dataset}"),
  bucket     = "calcofi-files-public",
  exclude    = c(".DS_Store", "*.tmp", "*.gdoc"))
d_raw <- read_csv(zs_csv)
num <- function(x) suppressWarnings(as.numeric(trimws(as.character(x))))

d <- d_raw |>
  transmute(
    taxon_slug         = taxon,
    cruise_orig        = trimws(cruise),
    line               = num(line),
    station            = num(station),
    latitude           = num(latitude),
    longitude          = num(longitude),
    max_depth_m        = num(max_depth_m),
    min_depth_m        = num(min_depth_m),
    cruise_mid_date    = as.Date(cruise_mid_date),
    station_date       = as.Date(station_date),
    local_time_pst     = trimws(local_time_pst),
    day_night          = trimws(day_night),
    abundance_per_m2   = num(abundance_per_m2),
    biomass_mgC_per_m2 = num(biomass_mgC_per_m2),
    feret_diameter_mm  = num(feret_diameter_mm),
    carbon_content_indiv = num(carbon_content_indiv)) |>
  mutate(
    # ZooScan reports longitude as positive degrees West — flip to negative (°E)
    longitude = -abs(longitude),
    year     = as.integer(str_sub(cruise_orig, 1, 4)),
    month    = as.integer(str_sub(cruise_orig, 5, 6)),
    ship_key = str_sub(cruise_orig, 7),
    site_key = if_else(
      is.na(line) | is.na(station), NA_character_,
      sprintf("%05.1f %05.1f", line, station)),
    datetime_local_pst = suppressWarnings(
      ymd_hm(paste(station_date, local_time_pst), quiet = TRUE)),
    sample_key = paste(cruise_orig, line, station, station_date, sep = "|"))

cat(glue(
  "Read {format(nrow(d), big.mark=',')} (sample x taxon) rows; ",
  "{n_distinct(d$sample_key)} samples; {n_distinct(d$taxon_slug)} taxa; ",
  "lines {paste(sort(unique(d$line)), collapse='/')}; ",
  "{min(d$year)}-{max(d$year)}"), "\n")
```
## Build Taxon Table (WoRMS)
`zooscan_taxon` is the 23 bioclasses with WoRMS AphiaIDs + classification,
resolved offline and cached in `metadata/cce-lter/zooscan/taxon_worms.csv`
(19/23 matched; 4 non-taxonomic operational classes, Q03).
```{r}
#| label: taxon
d_worms <- read_csv(here("metadata/cce-lter/zooscan/taxon_worms.csv"))

zooscan_taxon <- d_worms |>
  arrange(taxon_slug) |>
  transmute(
    taxon_id        = row_number(),
    taxon_zooscan, taxon_slug,
    aphia_id        = as.integer(aphia_id),
    scientific_name = scientific_name_accepted,
    rank, taxon_status = status, taxon_note,
    kingdom, phylum, class, order_taxon = order, family)

stopifnot("taxon_slug mismatch source vs WoRMS map" =
            all(unique(d$taxon_slug) %in% zooscan_taxon$taxon_slug))
dbWriteTable(con, "zooscan_taxon", zooscan_taxon, overwrite = TRUE)
cat(glue("zooscan_taxon: {nrow(zooscan_taxon)} bioclasses ",
         "({sum(!is.na(zooscan_taxon$aphia_id))} WoRMS-matched, ",
         "{sum(zooscan_taxon$taxon_status=='non-taxonomic')} non-taxonomic [Q03])"), "\n")
```
## Build Sample Table + Resolve Keys
One row per distinct station tow. `ship_key` (the cruise-code suffix) joins the
shared ship registry for `ship_nodc`/`ship_name`; `cruise_key` is
`YYYY-MM-{ship_nodc}` validated against the cruise registry.
```{r}
#| label: sample-keys
# position/depth are sample properties, but the per-class plot CGI leaves them
# NA on some taxa's rows (e.g. gelatinous classes) — recover the (identical)
# non-NA value per sample; identity columns are constant within sample_key
d_sample0 <- d |>
  group_by(sample_key) |>
  summarize(
    cruise_orig = first(cruise_orig), year = first(year), month = first(month),
    ship_key = first(ship_key), line = first(line), station = first(station),
    site_key = first(site_key), cruise_mid_date = first(cruise_mid_date),
    station_date = first(station_date), local_time_pst = first(local_time_pst),
    day_night = first(day_night), datetime_local_pst = first(datetime_local_pst),
    latitude    = mean(latitude,    na.rm = TRUE),
    longitude   = mean(longitude,   na.rm = TRUE),
    max_depth_m = mean(max_depth_m, na.rm = TRUE),
    min_depth_m = mean(min_depth_m, na.rm = TRUE),
    .groups = "drop")
stopifnot("sample_key not unique over sample attributes" =
            n_distinct(d_sample0$sample_key) == nrow(d_sample0))

load_prior_tables(
  con, parquet_dir = cc_stage_path("parquet", "swfsc_ichthyo"),
  tables = c("ship", "cruise", "grid"), geom_tables = c("grid"), as_view = TRUE)
d_ship <- dbGetQuery(con, "SELECT ship_key, ship_nodc, ship_name FROM ship")
valid_ck <- dbGetQuery(con, "SELECT DISTINCT cruise_key FROM cruise")$cruise_key

# cruise_key: the reference cruise whose date span holds the station date, else
# the source's own year/month designation, keys not in `cruise` left NULL
# (calcofi4db::resolve_cruise_key)
dbWriteTable(con, "zk", d_sample0 |>
  transmute(sample_key, ship_key, datetime = station_date,
            cruise_ym = sprintf("%04d%02d", year, month)), overwrite = TRUE)
resolve_cruise_key(con, "zk", datetime_col = "datetime", cruise_ym_col = "cruise_ym",
                   require_in_cruise = TRUE) |>
  datatable(caption = "cruise_key resolution method")
d_sample <- d_sample0 |>
  left_join(d_ship, by = "ship_key") |>
  left_join(dbGetQuery(con, "SELECT sample_key, cruise_key FROM zk"), by = "sample_key") |>
  arrange(cruise_orig, line, station, station_date) |>
  mutate(sample_id = row_number(), .before = 1)

sample_map     <- d_sample |> select(sample_id, sample_key)
zooscan_sample <- d_sample |>
  select(sample_id, cruise_orig, cruise_key, ship_key, ship_name,
         line, station, site_key, latitude, longitude,
         max_depth_m, min_depth_m, cruise_mid_date, station_date,
         local_time_pst, datetime_local_pst, day_night)
dbWriteTable(con, "zooscan_sample", zooscan_sample, overwrite = TRUE)

n_ship   <- sum(!is.na(d_sample$ship_name))
n_cruise <- sum(!is.na(d_sample$cruise_key))
cat(glue(
  "zooscan_sample: {nrow(zooscan_sample)} samples; ",
  "ship {n_ship}/{nrow(d_sample)} ({round(100*n_ship/nrow(d_sample),1)}%), ",
  "cruise_key {n_cruise}/{nrow(d_sample)} ({round(100*n_cruise/nrow(d_sample),1)}%)"), "\n")
```
## Add Spatial
```{r}
#| label: spatial
add_point_geom(con, "zooscan_sample", lon_col = "longitude", lat_col = "latitude")
grid_stats <- assign_grid_key(con, "zooscan_sample")
grid_stats |> datatable(caption = "Grid assignment")
```
## Pivot Measurements to Long Format
The four ZooScan metrics pivot into long form, joined to `sample_id` (via
`sample_key`) and `taxon_id` (via `taxon_slug`). Explicit zeros (imaged-but-
absent) are retained; only NA / non-finite values are dropped.
```{r}
#| label: measurement
meas_recode <- c(
  abundance_per_m2     = "zooscan_abundance",
  biomass_mgC_per_m2   = "zooscan_biomass_carbon",
  feret_diameter_mm    = "zooscan_feret_diameter",
  carbon_content_indiv = "zooscan_carbon_individual")

zooscan_measurement <- d |>
  left_join(sample_map, by = "sample_key") |>
  left_join(zooscan_taxon |> select(taxon_id, taxon_slug), by = "taxon_slug") |>
  select(sample_id, taxon_id, all_of(names(meas_recode))) |>
  pivot_longer(cols = all_of(names(meas_recode)),
               names_to = "src_col", values_to = "measurement_value") |>
  filter(!is.na(measurement_value), is.finite(measurement_value)) |>
  mutate(measurement_type = unname(meas_recode[src_col])) |>
  arrange(sample_id, taxon_id, measurement_type) |>
  transmute(measurement_id = row_number(),
            sample_id, taxon_id, measurement_type, measurement_value)

dbWriteTable(con, "zooscan_measurement", zooscan_measurement, overwrite = TRUE)
cat(glue(
  "zooscan_measurement: {format(nrow(zooscan_measurement), big.mark=',')} rows ",
  "({format(sum(zooscan_measurement$measurement_value==0), big.mark=',')} explicit zeros)"), "\n")
```
## Add Measurement Types
```{r}
#| label: add-measurement-type
zs_types <- tibble(
  measurement_type = c("zooscan_abundance", "zooscan_biomass_carbon",
                       "zooscan_feret_diameter", "zooscan_carbon_individual"),
  description = c(
    "Zooplankton areal abundance from ZooScan optical imaging, by image-classified bioclass.",
    "Estimated zooplankton carbon biomass from ZooScan optical imaging, by bioclass.",
    "Mean Feret diameter (organism size) from ZooScan optical imaging, by bioclass.",
    "Mean individual carbon content from ZooScan optical imaging, by bioclass."),
  units = c("count/m2", "mgC/m2", "mm", "ugC"),
  is_canonical = c(TRUE, TRUE, NA, NA),
  `_source_column` = c("abundance_per_m2", "biomass_mgC_per_m2",
                       "feret_diameter_mm", "carbon_content_indiv"),
  `_source_table` = "zooscan_measurement",
  `_source_datasets` = "cce-lter_zooscan",
  `_qual_column` = NA_character_, `_prec_column` = NA_character_)

new_types <- zs_types |> filter(!measurement_type %in% d_meas_type$measurement_type)
if (nrow(new_types) > 0) {
  d_meas_type <- bind_rows(d_meas_type, new_types)
  write_csv(d_meas_type, meas_type_csv, na = "")
  cat(glue("Added measurement type(s): {paste(new_types$measurement_type, collapse=', ')}"), "\n")
} else cat("zooscan measurement types already registered\n")
dbWriteTable(con, "measurement_type", d_meas_type, overwrite = TRUE)
```
## Load Dataset Metadata
```{r}
#| label: load-dataset-metadata
d_dataset <- ingest_yaml_to_dataset_df(read_ingest_yaml(here()))
dbWriteTable(con, "dataset", d_dataset, overwrite = TRUE)
cat(glue("dataset: {nrow(d_dataset)} dataset(s) registered"), "\n")
```
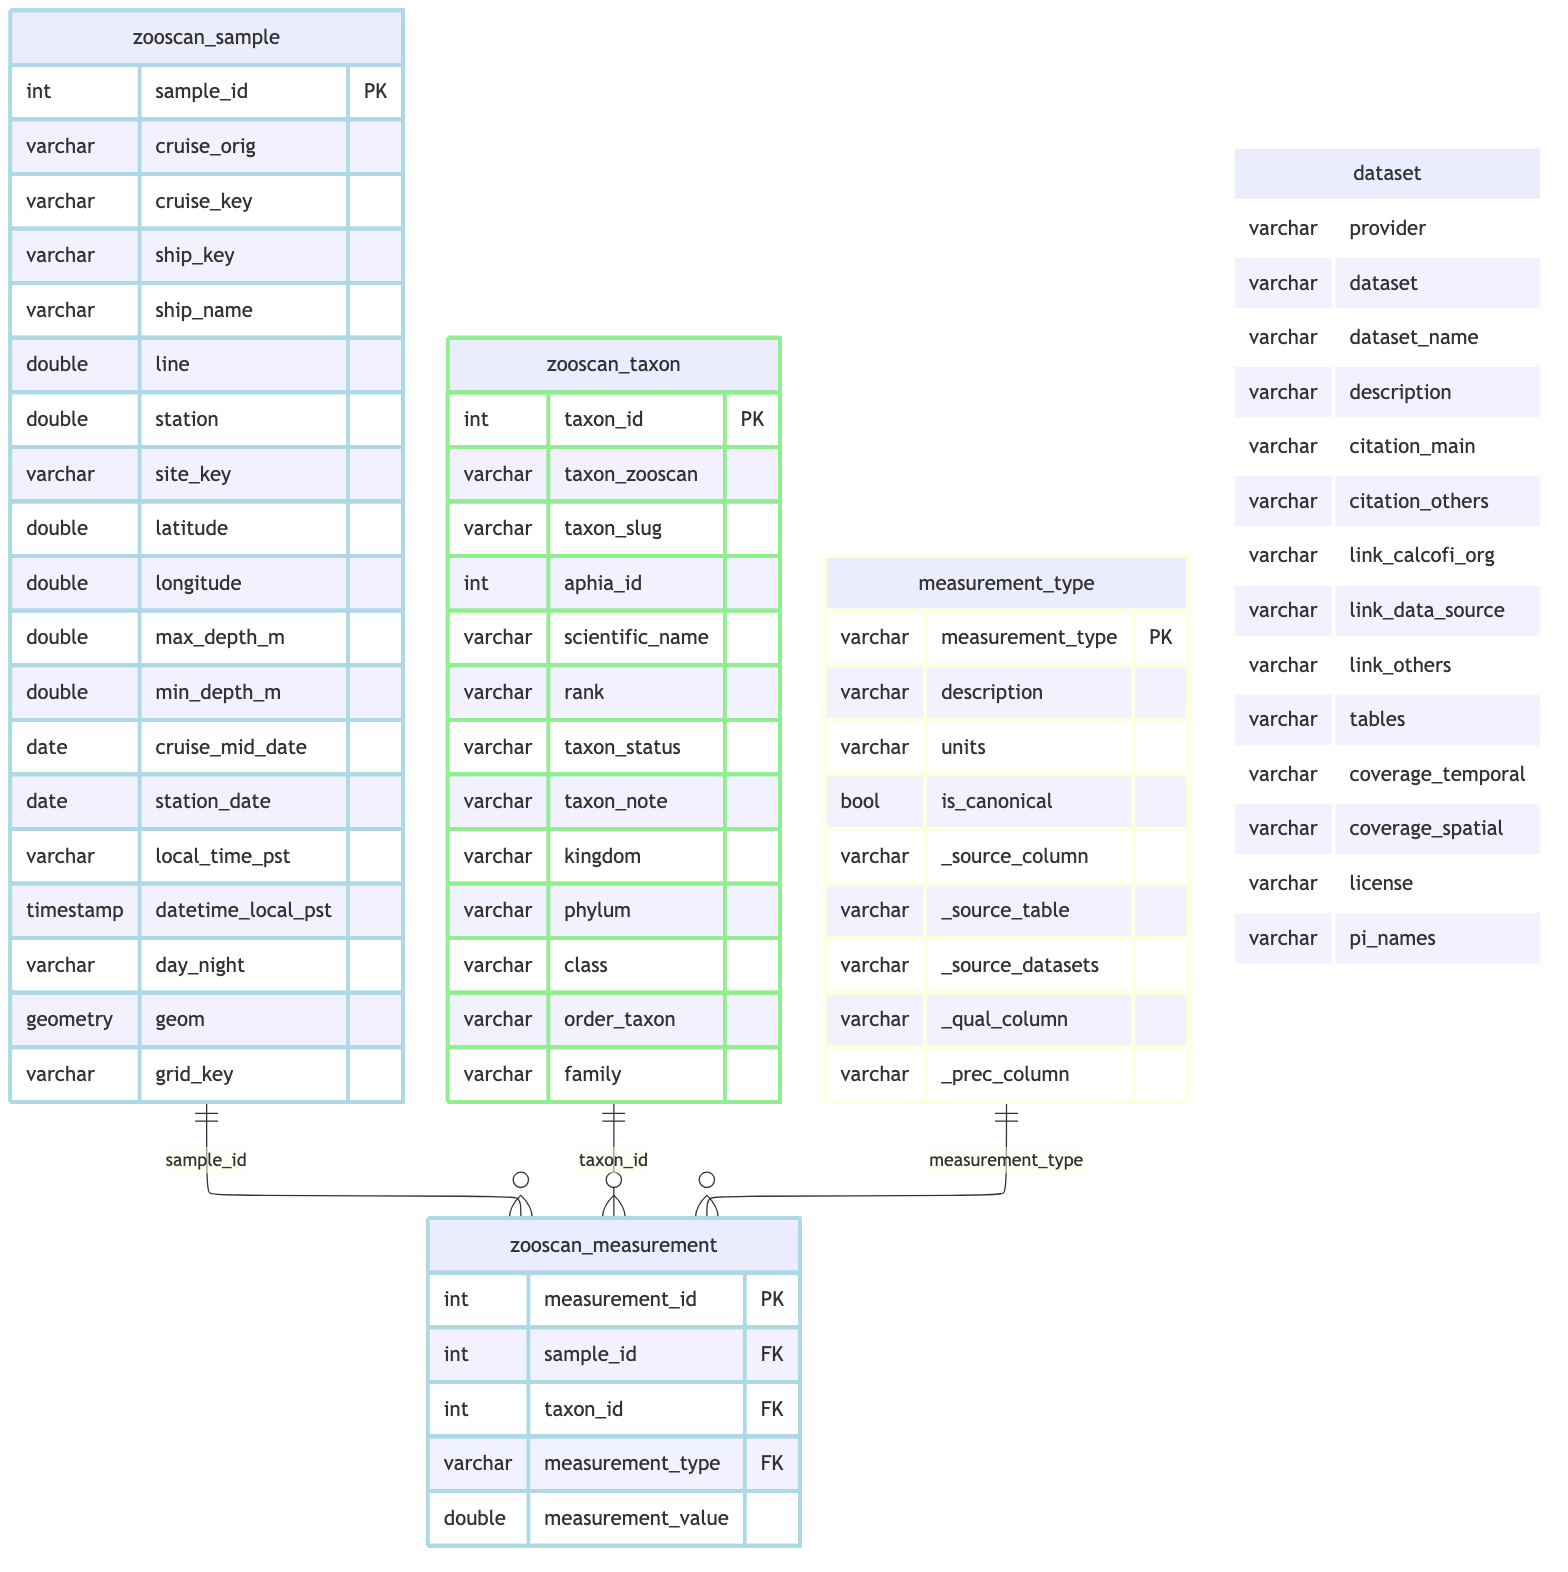
## Schema Documentation
```{r}
#| label: schema
zooscan_rels <- list(
  primary_keys = list(
    zooscan_sample      = "sample_id",
    zooscan_measurement = "measurement_id",
    zooscan_taxon       = "taxon_id",
    measurement_type    = "measurement_type"),
  foreign_keys = list(
    list(table = "zooscan_measurement", column = "sample_id",
         ref_table = "zooscan_sample", ref_column = "sample_id"),
    list(table = "zooscan_measurement", column = "taxon_id",
         ref_table = "zooscan_taxon", ref_column = "taxon_id"),
    list(table = "zooscan_measurement", column = "measurement_type",
         ref_table = "measurement_type", ref_column = "measurement_type")))

cc_erd(
  con,
  tables = c("zooscan_sample", "zooscan_measurement", "zooscan_taxon",
             "measurement_type", "dataset"),
  rels = zooscan_rels,
  colors = list(
    lightblue   = c("zooscan_sample", "zooscan_measurement"),
    lightgreen  = "zooscan_taxon",
    lightyellow = "measurement_type",
    white       = "dataset"))
# the SOURCE shape above documents the wrangling; the published tables are the
# consolidated core, so relationships.json is written with the parquet outputs
# below, from core_relationships().
```
## Validate
```{r}
#| label: validate
results <- validate_for_release(con, checks = "all", strict = FALSE)
cat("Validation:", ifelse(results$passed, "PASSED", "FAILED"), "\n")
if (length(results$errors) > 0)
  cat("Errors:\n", paste("-", results$errors, collapse = "\n"), "\n")
# NULLs in cross-dataset keys (cruise_key for cruises absent from the registry)
# are the EXPECTED unmatched remainder (Q02), not a hard failure.
cov <- dbGetQuery(con,
  "SELECT AVG(CASE WHEN ship_key   IS NOT NULL THEN 1 ELSE 0 END) ship,
          AVG(CASE WHEN cruise_key IS NOT NULL THEN 1 ELSE 0 END) cruise,
          AVG(CASE WHEN grid_key   IS NOT NULL THEN 1 ELSE 0 END) grid
   FROM zooscan_sample")
cat(glue("Match coverage: ship_key {round(100*cov$ship,1)}%, ",
         "cruise_key {round(100*cov$cruise,1)}%, grid_key {round(100*cov$grid,1)}%"), "\n")
orphan <- dbGetQuery(con,
  "SELECT SUM(CASE WHEN s.sample_id IS NULL THEN 1 ELSE 0 END) AS no_sample,
          SUM(CASE WHEN t.taxon_id  IS NULL THEN 1 ELSE 0 END) AS no_taxon
   FROM zooscan_measurement m
   LEFT JOIN zooscan_sample s USING (sample_id)
   LEFT JOIN zooscan_taxon  t USING (taxon_id)")
cat(glue("Orphan measurements: {orphan$no_sample} w/o sample, {orphan$no_taxon} w/o taxon"), "\n")
```
## Data Preview
```{r}
#| label: preview-sample
samp_cols <- dbGetQuery(con,
  "SELECT column_name FROM information_schema.columns
   WHERE table_name='zooscan_sample' AND data_type NOT LIKE 'GEOMETRY%'")$column_name
dbGetQuery(con, glue("SELECT {paste(samp_cols, collapse=', ')} FROM zooscan_sample LIMIT 100")) |>
  datatable(caption = "zooscan_sample — first 100 rows", rownames = FALSE, filter = "top")
```
```{r}
#| label: preview-measurement
dbGetQuery(con,
  "SELECT m.measurement_id, m.sample_id, x.taxon_zooscan, m.measurement_type, m.measurement_value
   FROM zooscan_measurement m JOIN zooscan_taxon x USING (taxon_id)
   ORDER BY m.measurement_id LIMIT 100") |>
  datatable(caption = "zooscan_measurement — first 100 rows", rownames = FALSE)
```
```{r}
#| label: preview-taxon
dbGetQuery(con,
  "SELECT t.taxon_id, t.taxon_zooscan, t.scientific_name, t.aphia_id, t.rank,
          t.taxon_note, COUNT(DISTINCT m.sample_id) AS n_samples
   FROM zooscan_taxon t LEFT JOIN zooscan_measurement m USING (taxon_id)
   GROUP BY ALL ORDER BY t.taxon_id") |>
  datatable(caption = "zooscan_taxon — 23 bioclasses", rownames = FALSE)
```
## Emit Core Tables
Project this dataset into the shared consolidated core model
(`design_env-bio-consolidation.md`). These core tables **are** this ingest's output: `release_database.qmd` concatenates the
per-dataset shards rather than re-deriving the core from per-dataset tables, so
there is exactly one projection to keep correct.
```{r}
#| label: emit_core
ds_key <- "cce-lter_zooscan"
# filter the crosswalk to THIS dataset -- an unfiltered read leaks other datasets'
# taxa into this shard (the retired emit_core_tables() wrapper filtered internally)
mt_taxon <- read_csv(here("metadata/measurement_taxon.csv"),
                     col_types = cols(worms_id = "i", itis_id = "i",
                                      bin_value = "d", .default = "c")) |>
  filter(dataset_key == ds_key)
tx_over  <- read_csv(here("metadata/taxon_override.csv"), show_col_types = FALSE)

# This projection lives here, in the notebook that owns the dataset, not in a
# switch(dataset_key, ...) arm inside calcofi4db. The reusable SHAPES stay in the
# package (sample_arm_self / compat_measurement_sql), so this is a declaration.

# the vocabulary is DECLARED here and RESOLVED by the package (taxon plan D1,
# calcofi4db >= 3.29.0): append_dataset_taxon() stages one `dataset_taxon` row
# per local taxon_id with `taxon_key` empty and the AphiaID the SOURCE supplied
# carried along as `ds_source_json`; resolve_dataset_taxon() fills the key from
# the authorities. There is no zooscan arm inside calcofi4db any more -- a column
# renamed or dropped here now fails at this call rather than becoming NA at
# release. The source's denormalized lineage columns are NOT staged: the
# classification the release publishes comes from ensure_taxon_lineage(), the
# authority, not from the export's copy of it.
d_vocab <- dbGetQuery(con, "
  SELECT CAST(taxon_id AS VARCHAR) AS ds_taxa_code,
         scientific_name           AS ds_scientific_name,
         taxon_zooscan AS ds_common_name,
         CAST(aphia_id AS INTEGER) AS worms_id,
         rank
  FROM zooscan_taxon ORDER BY taxon_id")
n_staged <- append_dataset_taxon(con, ds_key, d_vocab)

# cross-reference: resolve each taxon against BOTH authorities (cached in
# metadata/taxon_xref.csv, so a re-run costs no API calls). This fills the
# `worms_id` COLUMN on itis:-keyed taxa without touching their key — a consumer
# joining on worms_id used to match ZERO rows for every seabird and marine
# mammal — backfills `itis_id` the other way, replaces an id its authority has
# deprecated so the key is always an accepted id, and fetches the real
# `taxonomic_status` with the date it was checked. Must precede the lineage
# fetch, which should ask about the accepted id, not the deprecated one.
ensure_taxon_xref(con, mt_taxon, tx_over,
                  cache_csv = here("metadata/taxon_xref.csv"))

# lineage: fetch each taxon's WoRMS/ITIS classification (cached in
# metadata/taxon_lineage.csv, so a re-run costs no API calls) and stage it as the
# `taxon` hierarchy build_taxon_reference() reads. Without it a crosswalk- or
# vocabulary-resolved taxon reaches the release with a key and a name and NOTHING
# else — no rank, no parent_taxon_key, no classification — so hierarchy rollups
# ("all Decapoda") silently match nothing and no error is raised anywhere.
ensure_taxon_lineage(con, mt_taxon, tx_over,
                     cache_csv = here("metadata/taxon_lineage.csv"))
n_taxon    <- build_taxon_reference(con, mt_taxon, tx_over)
n_ds_taxon <- resolve_dataset_taxon(con, mt_taxon, tx_over)

# the ingest asserts its own crosswalk (D6). ZooScan's bioclasses are
# OPERATIONAL, not taxonomic: four of the 23 name a life stage or an image
# artefact rather than an organism, so they key dataset-locally by declaration --
# one key at a time, so a genuinely unresolved taxon cannot hide among them (Q03).
local_allow <- tibble::tribble(
  ~ds_taxa_code, ~why,
  "13", "eggs - a life stage, not a taxon",
  "15", "multiples - more than one organism in the vignette",
  "16", "nauplii - a crustacean larval stage across taxa",
  "18", "others - the residual bioclass")
obs_codes <- dbGetQuery(con,
  "SELECT DISTINCT CAST(taxon_id AS VARCHAR) AS c FROM zooscan_measurement
   WHERE taxon_id IS NOT NULL")$c
chk_taxon <- check_dataset_taxon(
  con, ds_key, allow = paste0(ds_key, ":", local_allow$ds_taxa_code),
  codes = obs_codes)
cat(glue("vocabulary: {n_staged} bioclasses staged; {nrow(local_allow)} keyed ",
         "dataset-locally by declaration; taxon {n_taxon}, ",
         "dataset_taxon {n_ds_taxon}"), "\n")
append_sample(con, sample_arm_self(
  ds_key, "zooscan_sample", "sample_id", "tow",
  dt_col = "station_date", site_expr = "site_key",
  depth_min = "min_depth_m", depth_max = "max_depth_m"))

append_obs(con, glue("
  SELECT 'bio', '{ds_key}', {ns_key(ds_key, 'tow', 'sp.sample_id')},
         sp.grid_key, sp.cruise_key, sp.latitude, sp.longitude,
         CAST(sp.station_date AS TIMESTAMP), sp.min_depth_m, sp.max_depth_m,
         dt.taxon_key, NULL::VARCHAR, m.measurement_type, m.measurement_value,
         NULL::VARCHAR, NULL::DOUBLE
  FROM zooscan_measurement m JOIN zooscan_sample sp USING (sample_id)
  LEFT JOIN dataset_taxon dt ON dt.dataset_key = '{ds_key}'
                            AND dt.ds_taxa_code = CAST(m.taxon_id AS VARCHAR)"))

core <- list(
  sample        = dbGetQuery(con, "SELECT COUNT(*) FROM sample")[[1]],
  obs           = dbGetQuery(con, "SELECT COUNT(*) FROM obs")[[1]],
  taxon         = n_taxon,
  dataset_taxon = n_ds_taxon)
cat(glue(
  "core projection — sample={core$sample %||% 0} obs={core$obs %||% 0} ",
  "taxon={core$taxon %||% 0} dataset_taxon={core$dataset_taxon %||% 0}\n"))
# every measurement must reach obs, and every obs must resolve a
# sampling event; taxon_key coverage is reported (the source vocabulary may
# include entries WoRMS does not resolve)
n_obs <- dbGetQuery(con, "SELECT COUNT(*) FROM obs")[[1]]
n_exp <- dbGetQuery(con, "
  SELECT COUNT(*) FROM zooscan_measurement m JOIN zooscan_sample sp USING (sample_id)")[[1]]
stopifnot(
  "obs must be one row per measurement" = n_obs == n_exp,
  "every obs.sample_key must resolve in sample" =
    dbGetQuery(con, "SELECT COUNT(*) FROM obs o LEFT JOIN sample s USING (sample_key)
                     WHERE s.sample_key IS NULL")[[1]] == 0)
n_tax <- dbGetQuery(con, "SELECT COUNT(*) FROM obs WHERE taxon_key IS NOT NULL")[[1]]
cat(glue("obs parity: {format(n_obs, big.mark = ',')} rows; ",
         "{round(100 * n_tax / max(n_obs, 1), 1)}% taxon-resolved"), "\n")
# serve the retired per-dataset table names as VIEWs over the core, so
# in-notebook consumers and ad-hoc queries keep working against the old names
# (exact for every column the core models, lossy for the rest)
invisible(dbExecute(con, "DROP TABLE IF EXISTS zooscan_measurement_src"))
invisible(dbExecute(con, "ALTER TABLE zooscan_measurement RENAME TO zooscan_measurement_src"))
invisible(dbExecute(con, glue(
  "CREATE OR REPLACE VIEW zooscan_measurement AS
   {compat_measurement_sql(ds_key, 'tow', 'sample_id', 'measurement_id')}")))
cat(glue("compat view zooscan_measurement over obs: ",
         "{dbGetQuery(con, 'SELECT COUNT(*) FROM zooscan_measurement')[[1]]} rows"), "\n")
```
## Write Parquet Outputs
```{r}
#| label: write-parquet
dir_create(dir_parquet)

mismatches <- list(
  measurement_types = collect_measurement_type_mismatches(
    con, here("metadata/measurement_type.csv")),
  cruise_keys = collect_cruise_key_mismatches(con, "zooscan_sample"))

tbls_out <- core_output_tables(con, extra = c("measurement_type", "dataset"))
parquet_stats <- write_parquet_outputs(
  con        = con,
  output_dir = dir_parquet,
  tables     = tbls_out,
  sort_by    = list(obs = c("grid_key", "measurement_type")),
  strip_provenance = FALSE,
  mismatches = mismatches)

build_relationships_json(
  rels = core_relationships(tbls_out), output_dir = dir_parquet,
  provider = provider, dataset = dataset)
parquet_stats |> mutate(file = basename(path)) |> select(-path) |>
  datatable(caption = "Parquet export statistics")
```
## Write Metadata
```{r}
#| label: write-metadata
d_tbls_rd <- read_csv(here("metadata/cce-lter/zooscan/tbls_redefine.csv"))
d_flds_rd <- read_csv(here("metadata/cce-lter/zooscan/flds_redefine.csv"))

metadata_path <- build_metadata_json(
  con        = con,
  d_tbls_rd  = d_tbls_rd,
  d_flds_rd  = d_flds_rd,
  metadata_derived_csv = c(here("metadata/core_dictionary.csv"),
                           here("metadata/cce-lter/zooscan/metadata_derived.csv")),
  output_dir = dir_parquet,
  tables     = tbls_out,
  set_comments = TRUE,
  provider   = provider,
  dataset    = dataset,
  workflow_url = cc$workflow_url,
  tables_owned = tables_owned)
```
## Upload to GCS
```{r}
#| label: upload-gcs
sync_to_gcs(
  local_dir   = dir_stage,
  sidecar_dir = dir_parquet,
  gcs_prefix = glue("ingest/{dir_label}"),
  bucket     = "calcofi-db")
```
## Questions for Data Providers
Follow-up questions for CCE-LTER (Mark Ohman, Marina Frants), tracked in
`metadata/cce-lter/zooscan/questions.csv`.
```{r}
#| label: provider-questions
# one validated read + render for every ingest: the vocabulary and the column
# order live in calcofi4db, not in 16 hand-written factor() calls
questions_datatable(
  here(cc$questions_file),
  caption = "Questions for the CCE-LTER ZooScan data providers (ranked)")
```
## Cleanup
```{r}
#| label: cleanup
close_duckdb(con)
cat(glue("Parquet outputs written to: {dir_parquet}"), "\n")
```
::: {.callout-caution collapse="true"}
## Session Info
```{r session_info}
devtools::session_info()
```
:::